Breath-by-Breath Analysis Of Juicy Fruit Gum
The flavour we experience is largely the result of our sense of smell. It is therefore potentially of interest to see the time-dependent concentration of flavour compounds in breath on a "chew-by-chew" basis, as well as on longer time-scales, for example the breathing cycle. The time-of-flight approach, with list-file storage of data, allows results to be viewed at various temporal resolutions. Interesting time correlations can be investigated by reprocessing the data, avoiding the need to repeat the experiment. To demonstrate the potential the PTR-TOFMS was used to sample breath during the consumption of a "Juicy Fruit Gum"
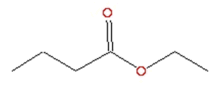
The principle compound released during chewing of Juicy Fruit gum is ethyl butyrate, molecular mass 116
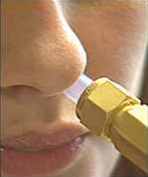 A soft tube is inserted lightly into the nostril of the subject who
breaths normally and the mass spectrometer begins acquiring data. Most
of the exhaled breath passes out into open space, but a side-mounted
capillary pipe samples the breath into the proton transfer reactor. All mass
peaks are collected simultaneously in a continuous measurement.
A soft tube is inserted lightly into the nostril of the subject who
breaths normally and the mass spectrometer begins acquiring data. Most
of the exhaled breath passes out into open space, but a side-mounted
capillary pipe samples the breath into the proton transfer reactor. All mass
peaks are collected simultaneously in a continuous measurement.
There is always a little acetone on the breath. As this is not present in the fruit gum it can be used to trace the subject's beathing pattern. Therefore the data is first processed to show acetone concentration as a function of elapsed time to give a smoothly varying cyclic curve with a period of approximately 12s
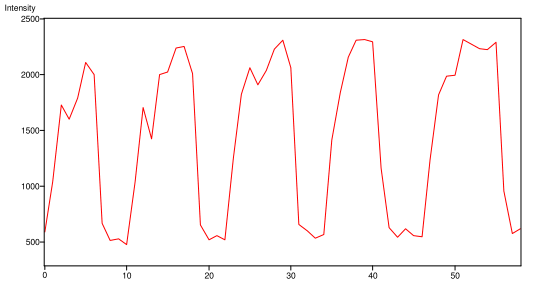
Acetone concentration vs elapsed time using a 1s integration
The ethyl butyrate gives a strong protonated peak at 117 Daltons. Thus we examine the 117 peak intensity as a function of elasped time. We can do the processing using various effective integration times, trading time resolution against the precision, or dynamic range with the aim of showing sub-structure within a single breath?
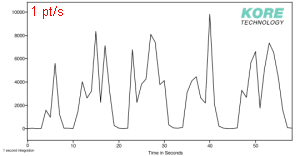
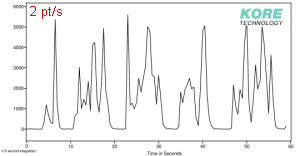
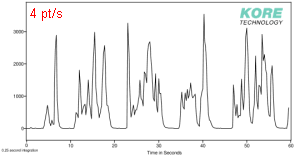
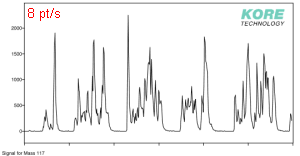
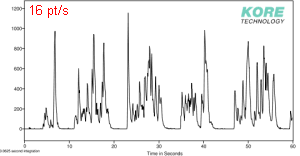
A series of plots of ethyl butyrate concentration vs elapsed time. The number of points per
second in the plots, the time resolution, is varied between 1 and 16
Looking at the development of the ethyl butyrate plots with increasing time resolution, we can see that the useful limit is somewhere in the region of 8 points per second.
Mass spectra can also be extracted from any chosen time slice.
Top
Last updated: 15:34 25/02/2014
© Kore Technology Limited 2014