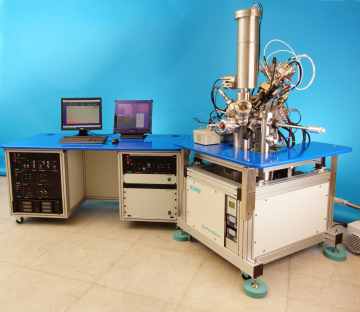
The SurfaceSeer-I: Imaging Surface Analysis by TOF-SIMS
- Very high surface sensitivity (1x10⁹ atoms/cm2 )
- Very simple to use (1 day training)
- Conducting and insulating surfaces
- Positive and Negative SIMS
- >3000 M/ΔM using time-of-flight Reflectron mass analyser
- Mass range >1000m/z
- Mass accuracy of ± 5mamu.
- Analytical spatial resolution to 0.5µm
- Elemental and molecular information
- Separates common organics from elements
- Isotopic analysis
- Sputter cleaning capability
- 5 minute sample pump down from atmosphere
- 1 minute analysis
- Affordable
- Expandable
- Data libraries available
- Overview
- Instrument details
-
Example Data
- Mass Resolution and Mass Accuracy
- Imaging with the secondary electron detector
- Chemical mapping - positive and negative ions
- Selective spectrum extraction using a chemical map
- Distributed charge pixel order for challenging samples
Overview
The SurfaceSeer-I has been designed for high spatial resolution imaging or chemical mapping. Our SurfaceSeer-I does not compete with the $1m plus high performance SIMS instruments that are aimed primarily at the microelectronics industries. Rather in SurfaceSeer-I, we provide to customers with limited budgets an Imaging TOF-SIMS instrument with typically more than enough performance for their requirements in quality control and research.
The SurfaceSeer-I uses the same TOFMS technology as the SurfaceSeer-S, but is fitted with a high brightness high spatial resolution 25 kV liquid metal ion gun (LMIG) as the primary ion source. Additional computer control allows the gun to be scanned during the mass spectral acquisition so that chemical images, or maps, may be collected. A secondary electron detector is also provided for tuning of the primary beam.
We have re-designed the SurfaceSeer instrument support system to locate the analytical chamber on a 'floating sub-frame' inside the main instrument frame, thus isolating vibrations from the ground and allowing for better spatial resolution performance. Also the electronics controls are placed in separate racks to reduce cooling fan vibration and noise.

Holder for four samplesA variety of sample holders are available, to allow for a range of sample thicknesses and diameters. When the diameter is small, up to four samples may be mounted simultaneously, using quick and simple clamp mechanisms to hold them against apertures in a cover plate.
Instrument details
Primary Ion Gun
A high performance liquid metal ion beam system (LMIG) designed to provide a range of ion beams for SIMS applications. It offers a wide current range with fine probe capability and d.c. or pulsed operation. Digital control allows easy set-up of the gun and a provision for remote control is included.
The gun column consists of a liquid metal ion source and a high precision two-lens optics assembly, including:
- Stigmation and alignment units
- Aperture selection, to allow a wide choice of output current (normally manual, but there is a motorised option)
- Optional Mass filter, used with alloy sources
- Deflection plates for blanking the beam
- Optional Pulse bunching
- Raster plates for imaging
A variety of source species are possible. For TOF-SIMS a common choice is monisotopic gallium (69Ga), in which case the optional mass filter is not required. Another possibility is to use a gold-germanium eutectic alloy, which yields a range of primary ions, one of which is selected by means of the mass-filter in the ion column. These ions are heavier than gallium, particularly the clusters, which can give greatly enhanced yields of organic secondary ions in some applications. A gold-germanium source typically provides the following ions:
Species % of Beam Current Au+ 58.9% Au++ 16.2% Au2+ 6.4% Au3+ 4.3% Au3++ 1.4% Secondary Electron Detection
For an imaging TOF-SIMS system it is essential to have a secondary electron imaging system. This has three main functions:
- To focus the primary ion beam
- To permit the beam to be set for 'motionless blanking' - this is a tuning that permits the ion beam to be blanked at high speed with minimal distortion of the beam (necessary for TOF-SIMS imaging)
- To obtain ion-induced secondary electron images. This latter function can only be achieved with a continuous primary ion beam, and is normally reserved for when all analytical work is complete on a sample
The SED system comprises a channeltron detector inside the analytical chamber, with the SED preamplifier mounted on the external flange. A power supply unit with SED controls is made available on a separate 'sample viewing' electronics unit.
Optical Viewing
In surface analysis, it is extremely helpful to view the sample optically to assist in navigation and to determine the correct location for subsequent analysis. Kore has developed a viewing system with the following capabilities:
- Zoom from ~3mm to ~400µm field of view.
- High lateral optical resolution at high magnification (<5µm).
- A long working distance of 175 mm ideally suited to ultrahighvacuum chambers where it is not possible to locate a camera near to the sample.
- Mounting onto a 70mm OD CF window.
- A colour camera mounted on the microscope.
- Dedicated colour monitor display.
- Cold, dichroic halogen illuminator mounted on a 70mm OD CF window.
- Power supplies for the illuminator and camera
Sample Handling
X, Y, Z High Stability Stage. The stage has motions of ~ ±10mm in X and Y and 2mm in Z.
There is a concept of an optimum z height at which all the beams are confocal. The sample surface is brought to this position. If the sample is relatively thick >1mm, then there are two possibilities:
- The sample can be 'back-mounted', meaning that the sample is located behind a mask that is at the correct height. The maximum thickness of sample that can be mounted in this way is ~5mm (5 high x 8 wide x 20mm)
- The sample is 'top-mounted' onto a sample holder with a cutaway of 1mm (deeper on request)
For top-mounted thicker samples, it is possible to use the z height adjustment of the stage to lower the sample holder so that the sample surface is positioned at the correct height.
Samples are pumped down within 2-10 minutes in a small volume load lock and are then entered into the analytical chamber (via a manual gate valve) with a simple forward motion and 90° twist action of a magnetically coupled sample introduction rod. Porous or 'wet' samples can take longer to pump down.
Delayed Extraction
The instrument also employs a technique known as 'delayed extraction' for the secondary ions produced. In this technique the primary ions bombard the surface and produce the analytically important secondary ions. A short time after the primary beam pulse has finished bombarding the sample, the ion extraction field is pulsed on. This results not only in secondary ion extraction, but also secondary ion compression as the ions travel through the analyser to the detector. In some TOF-SIMS instruments the primary beam is compressed or 'bunched', but in this instrument it is the secondary ions that are bunched. This delayed extraction is set so that the secondary ions of the same m/z are temporally focused to produce better mass resolution than would otherwise be obtained with the long primary pulse (60ns) on its own.
Charge Neutralisation
One of the advantages of using a pulsing ion beam/delayed extraction combination is that there are relatively long periods in each TOF cycle when there is no ion extraction field applied. In that period a pulse of low energy electrons (30eV) is directed at the analytical area. By doing this it is possible to neutralise the effect of positive charge that would otherwise build up on the surface as the primary ion beam bombards an insulating sample.
TOF Analyser
The instrument has a 150mm diameter reflectron analyser, with a total effective flight-length (including the flight tube) of 2 metres. It is a dual-slope reflectron with in-vacuo high precision resistors, and has an adjustable 'retard' potential within the reflectron that has been set for optimum spectral performance.
Vacuum Pumping
Vacuum pump controllers are integrated into the main instrument frame. Two ion pumps maintain vacuum in the analytical chamber and LMIG source. A turbomolecular pump is used for the sample load lock, backed by a 2-stage rotary pump. Load lock venting and pumping is achieved with a single manual button. A high vacuum gauge (inverted magnetron) monitors the pressure in the analytical chamber at all times, and is used to provide vacuum interlock protection, shutting down high voltages if the pressure rises beyond a set point.
Expansion
The current instrument has been designed to permit the following additions:
Depth Profiling with a second ion source
The LMIG is not suitable for eroding craters, therefore, in order to perform SIMS depth profiling, we use a second ion gun dedicated to sputtering.
By having a second, dedicated ion gun, we can also vary the energy of the sputtering ion beam. For instance, for shallow depth profiles of a few hundred nanometers, it will be appropriate to use perhaps 1keV impact energy, whereas for deeper profiles 2-3keV will be appropriate.
This is rather similar to XPS and Auger depth profiling in that the analytical phase and the sputtering phase are separated. The technique works by repeatedly looping through the following steps:
- Analysis is performed in pulsed beam mode using the analytical gun for x seconds in a small area, where x is a user-definable time, to acquire data with significant statistics (experiment dependent).
- Analysis is stopped.
- The sputtering beam is turned on and rastered over a larger area. The sample is sputtered in continuous beam mode for y seconds to remove material, where y is a user-definable time, depending upon current and raster size.
- The sputtering gun is turned off, ready for the next repeat of step 1.
Data points in the depth profile are plotted at the end of each analytical 'phase'. A limited set of species is declared at the time of the 'live' acquisition, but after the run has finished the data may be replayed, and any combination of species may be re-plotted. This is made possible because information about every recorded ion is stored to disk, as the ion detection in a TOF-SIMS is 'parallel'.
Oxygen Leak (Oxygen Jet)
Positive secondary ion emission is greatly enhanced when the sample surface has a native oxide. If the experiment involves a high enough ion dose to strip away the native oxide, there is a dramatic fall in signal. A well known solution, used in dedicated depth profiling SIMS instruments, is to use an oxygen primary ion beam, which results in an oxygen-rich 'altered layer' and enhanced signal. It is also the case that a large percentage of that enhancement is achieved through oxygen co-implantation, achieved by jetting oxygen gas onto the sample surface whilst using an alternative primary beam species such as Ga+ or Ar+.
Accordingly, we offer an oxygen leak option in which a precision leak valve supplies oxygen down a capillary line close to the sample to 'jet' oxygen to the sample surface.
Example Data
Mass Resolution and Mass Accuracy
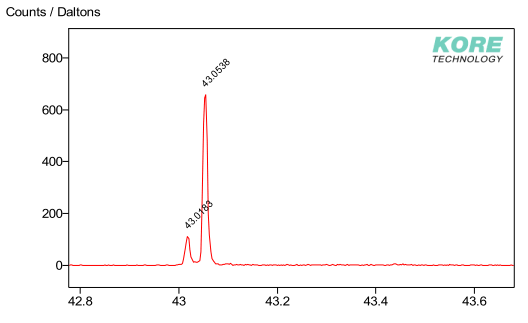
Mass accuracy for C3H7Using the following calibration species: C2H3, C3H5 and C4H7, you can interpolate and find the exact mass of mass 43 (C3H7), which is 43.0548. The mass accuracy as measured on the spectrum shown here is 43.0538, i.e. ~1m(amu).
The mass resolution in this spectrum is greater than 4000 FWHM. Generally speaking the SurfaceSeer-I does a little better than the SurfaceSeer-S in terms of mass resolution.
Imaging with the secondary electron detector
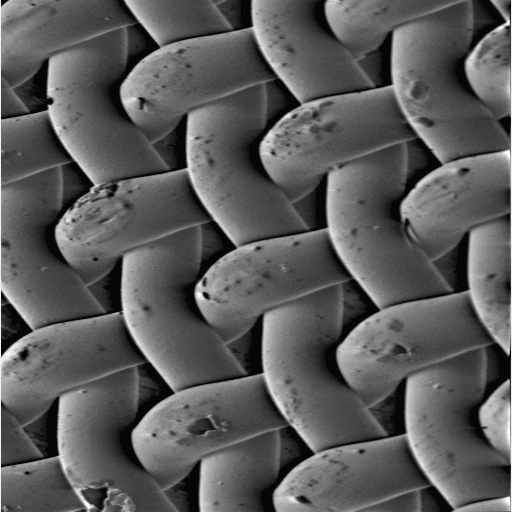
Secondary electron image (field of view 400µm)The image above shows a secondary electron image from a nickel coated woven polyester-mesh test sample. The primary beam consisted of 25keV Au+ ions. Such SEM images are available "live" on the computer monitor. They are useful for setting up of the primary column and occasionally also for providing topographic information from the sample, assuming that it is robust enough to stand the relatively high ion flux.
Chemical mapping - positive and negative ions
Positive and secondary ion maps (field of view 350µm)A slightly smaller section of the same nickel coated woven polyester mesh test sample is displayed above in the form of chemical maps taken in both positive (39K+, 58Ni+ Pk43+) and negative (35Cl-, CN-, Pk42-) SIMS modes. There is clearly some sort of contaminant smeared onto the highest portions of the mesh. Small tears are visible, which show dark in all the images. Chlorine (35Cl-) and Nickel (58Ni+) are both intense on the surface of the mesh. Presumably chlorine was present in the coating system. The CN- ion is common for contamination and can be seen on the underlying stub as well as the mesh itself. The peaks at 43 (+ve) and 42 (-ve) Daltons are from organic material. However, their distribution is very different.
Selective spectrum extraction using a chemical map

Oxide particles on a graphite substrate - C2- cluster ion and mask for particles
(field of view 250µm)In the image above a pyrolytic graphite substrate has been contaminated with particles of molybdenum oxide (this is a test sample; the particles were deposited deliberately to illustrate a common analytical problem). Coverage of the particles is less than one percent, so a spectrum taken over the whole image mostly contains peaks from the substrate. With a genuinely unknown contaminant, the low coverage can make it difficult to identify the particle composition, often the key to establishing where they have come from. Time-of-flight spectrometry is particularly good with a problem like this, assuming the raw data for the image is kept (the default behaviour when using SurfaceSeer-I). First a "mask" image is created from the dips in the substrate signal, as shown above right. Next the existing list file, collected when creating the map, is reprocessed to give two spectra: one using data from the black parts of the mask, a second with data from the white parts. These can then be compared.
Extracted spectra using mask - (red trace: mask=black; blue trace: mask=white)The spectra shown overlaid above have been built from the white (blue trace) and black (red trace) parts of the original mapping list-file, normalised by the number of pixels used for each so that they can be directly compared. In the lower mass part of the spectrum, a dip in carbon signal on the particles is clearly seen, as expected. In the section of mass spectrum shown above the molybdenum oxide peaks for the particles is unmistakably specific to that portion of the image, making identification of the particles straightforward.
Distributed-charge pixel order for challenging samples
When building an image, it is conventional to visit the pixels in a left-to-right, top-to-bottom order. However, there are occasions when something somewhat different can have advantages. The SurfaceSeer-I mapping code has been constructed so as to allow arbitrarily complex raster patterns. As an example, consider a highly insulating sample expected to have fairly low contrast in a chemical map image, where the long range intensity variations are of interest; for example the intent is to check that some compound is evenly distributed. Although the SurfaceSeer-I has a very effective charge neutralising system, if contrast is observed top to bottom in a conventionally rastered image, there would be concern that the pixel order might be influencing the results. The answer is to visit the pixels in a scattered fashion, attempting to spread any charge evenly over the field of view at all stages of the experiment.


Total ion image being built for inside of tea-bag paper - images 1 to 5 progression to single frame, image 6 is three frames (field of view 700µm)The images above show a map being built using a distributed-charge raster. The sample is a piece of paper that has been used to construct a tea bag, a rough and electrically insulating substrate. To demonstrate the raster shape, the total ion image is shown at various stages in building the first frame of pixels (images 1 to 5). Note how at each stage the pixels are scattered in a roughly even fashion through the image. The final image shows the map after a further two frames have been added.
TopLast updated: 17:56 08/05/2018
© Kore Technology Limited 2014